Avvio Rapido
Una panoramica di come è organizzata la piattaforma MangoLabs e come i pezzi si incastrano tra loro.
Cosa imparerai
- ▸La differenza tra backtest e simulazione (dati storici vs real-time)
- ▸Come funziona l'editor strategie visuale e i tipi di nodi disponibili
- ▸Il sistema delle Feature e come usarle nelle strategie
- ▸Il processo di Backtesting e l'analisi dei risultati
- ▸Come deployare strategie in Simulazione e monitorare l'esecuzione
Com'è Organizzata la Piattaforma#
La piattaforma copre l'intero workflow di una strategia, organizzato in tre fasi distinte soprattutto dal tipo di dati che ciascuna usa.
Costruzione e Backtest
Dove crei e testi le tue strategie su dati storici.
Tipo di dati: Storico
Simulazione
Ambiente dove testi le strategie in condizioni di mercato reali con capitale virtuale.
Tipo di dati: Real-time
Produzione
Ambiente previsto per il trading con capitale reale connesso agli exchange — non ancora disponibile.
Non disponibile al momento
Tipo di dati: Real-time
Differenza fondamentale: La costruzione e il backtest lavorano su dati storici per validare la strategia. La Simulazione lavora su dati real-time per testare il comportamento in condizioni di mercato attuali. Una volta validata, la strategia passa in Simulazione per la verifica finale prima di considerare l'operatività live.
Editor Strategie Visuale#
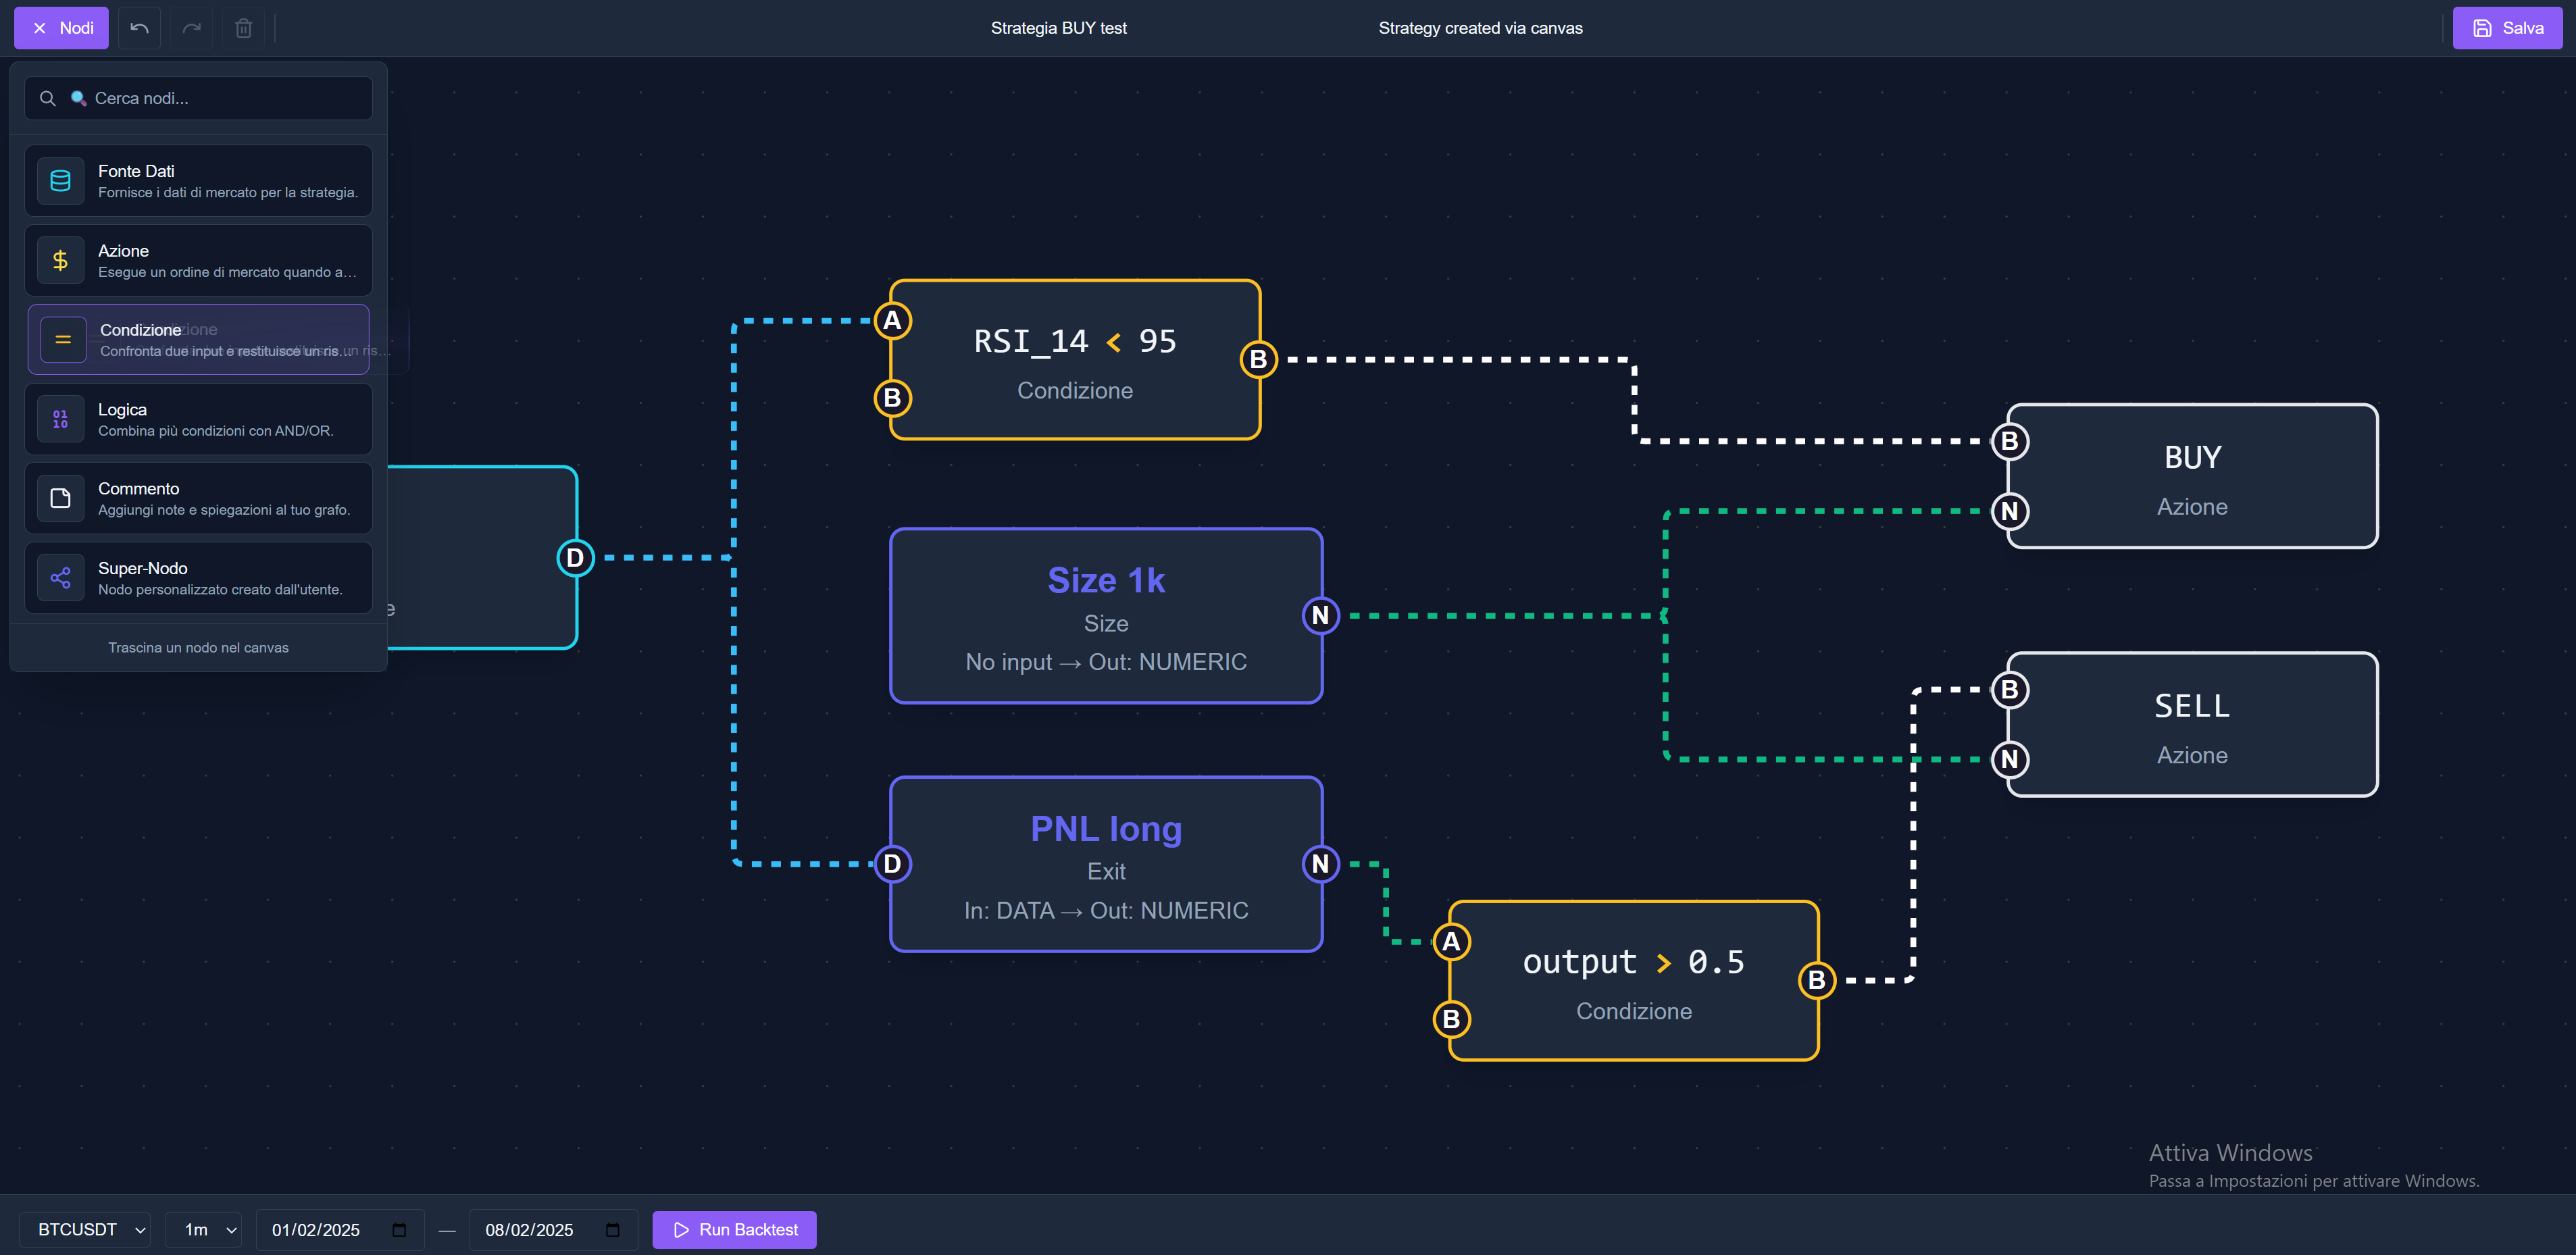
L'innovazione principale di MangoLabs è permetterti di costruire strategie di trading disegnando il ragionamento, non scrivendo codice. Trascini nodi su una canvas, li configuri e li colleghi: ogni connessione è un flusso di dati che passa da un nodo all'altro. Il sistema interpreta questo grafo ed esegue la tua logica tick-by-tick sul mercato.

Esempio di strategia completa: dai dati di mercato all'esecuzione dell'ordine
Nodi
Blocchi che eseguono operazioni specifiche: leggere dati, calcolare, verificare condizioni, generare segnali. Hanno input e output che colleghi tra loro per costruire la logica.
Connessioni
Trasferiscono dati da un nodo all'altro. Il sistema valida la compatibilità automaticamente e determina l'ordine di esecuzione: prima i nodi che producono i dati, poi quelli che li consumano.
Come Funziona l'Esecuzione
Ad ogni candela, la strategia parte dai nodi che leggono i dati (prezzi, indicatori, feature) e segue il flusso attraverso le elaborazioni e le condizioni fino ad arrivare ai nodi che generano gli ordini di trading. L'obiettivo è determinare quali azioni eseguire: comprare, vendere o non fare nulla.
Input Dati
Elaborazione
Output Azione
Nodi Strategia
Una strategia si compone di tipi di nodo ognuno con una funzione specifica, insieme al pannello Parametri (θ) per le costanti con nome. Li configuri, li colleghi tra loro e costruisci la logica di trading.
Nodo necessario che fornisce i dati di mercato: prezzi OHLCV, feature tecniche, stato del portafoglio
Gestisce gli ordini di trading: BUY per comprare, SELL per vendere, CLOSE per chiudere una posizione
Confronta due valori e restituisce vero o falso: maggiore, minore, uguale
Combina più condizioni con operazioni logiche: AND (entrambe vere), OR (almeno una vera)
Componenti riutilizzabili che incapsulano logiche complesse: crei una volta, usi ovunque
Annotazioni visive sulla canvas per documentare e organizzare la strategia
Palette dei nodi strategia: trascina i nodi sulla canvas per costruire la tua logica
Validazione in Tempo Reale Il sistema valida la strategia mentre la costruisci: verifica che tutte le connessioni siano compatibili, che non ci siano cicli, che i nodi Action ricevano i dati corretti. Se c'è un errore, ricevi feedback immediato prima di salvare.
Editor Super-Nodi
I Super-Nodi sono componenti riutilizzabili che accettano input e producono sempre output.
Servono a gestire calcoli complessi da utilizzare nelle strategie: ad esempio per calcolare il size delle posizioni o costruire indicatori real-time personalizzati.
Nodi Interni ai Super-Nodi
All'interno dei Super-Nodi puoi utilizzare solo nodi specifici per elaborazioni e calcoli:
Riceve dati dalla strategia principale
Restituisce i risultati elaborati
Operazioni matematiche: somma, sottrazione, moltiplicazione, divisione
Riutilizzo: I Super-Nodi possono essere salvati in libreria e riutilizzati in strategie diverse, evitando di ricostruire la stessa logica più volte.
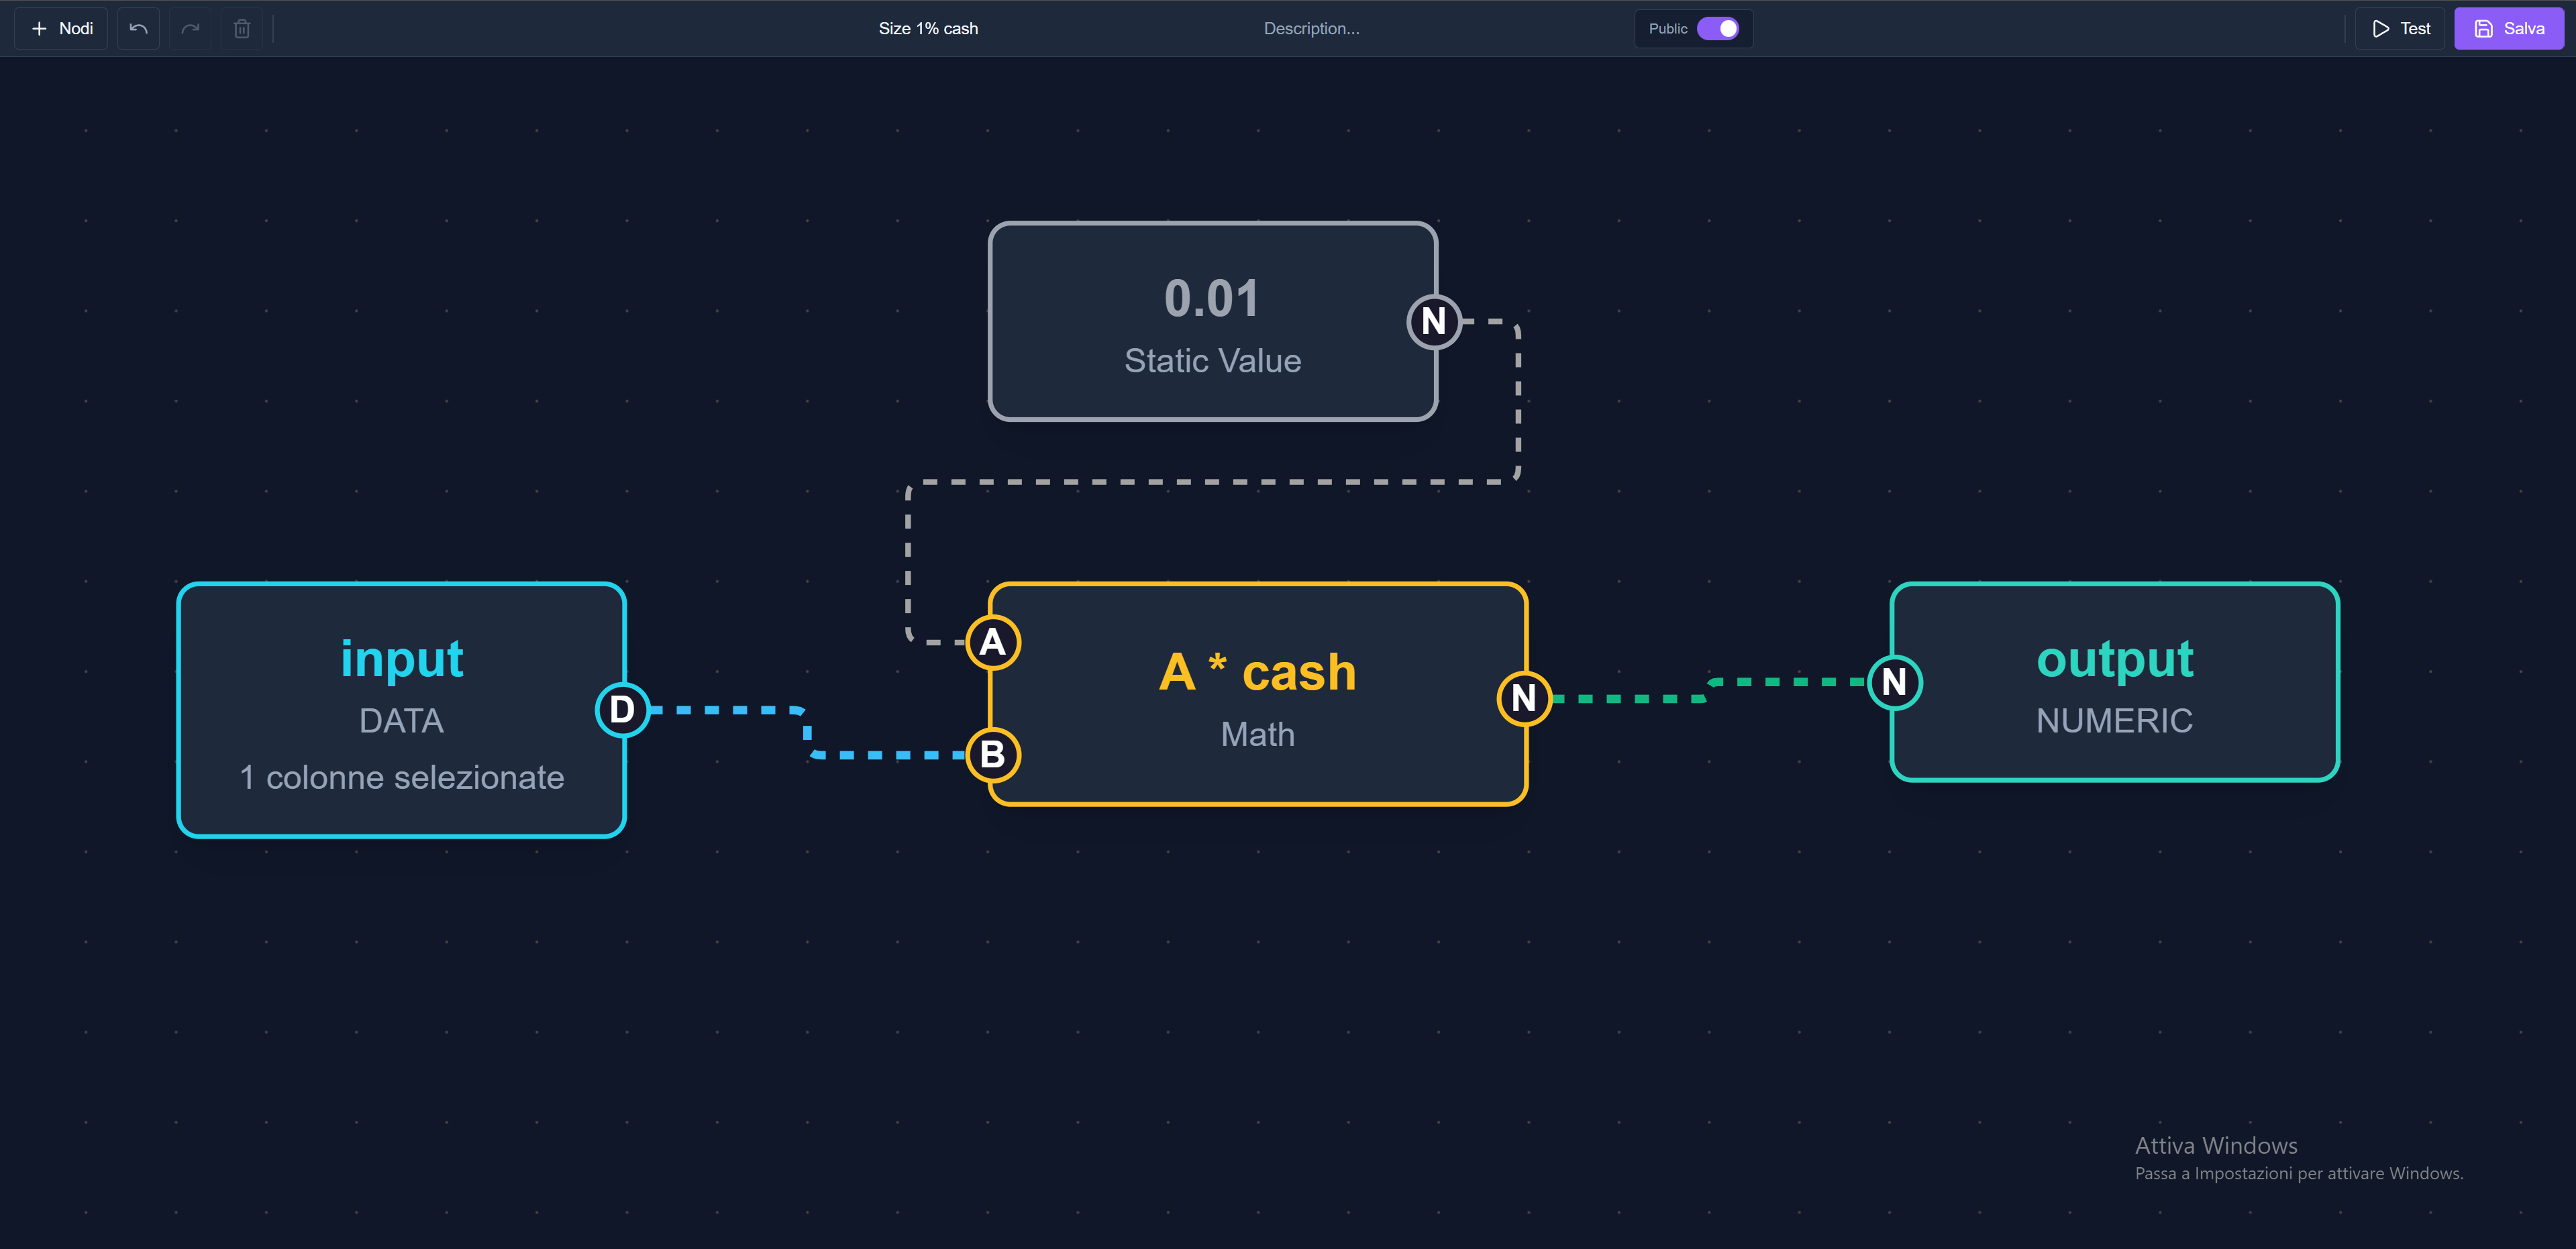
Editor Super-Nodi: costruisci calcoli complessi con nodi Input, Output e Math
Vedi in Azione
Pronto a costruire la tua prima strategia? Accedi all'editor visuale e inizia a disegnare la tua logica di trading.
Backtesting e Analisi#
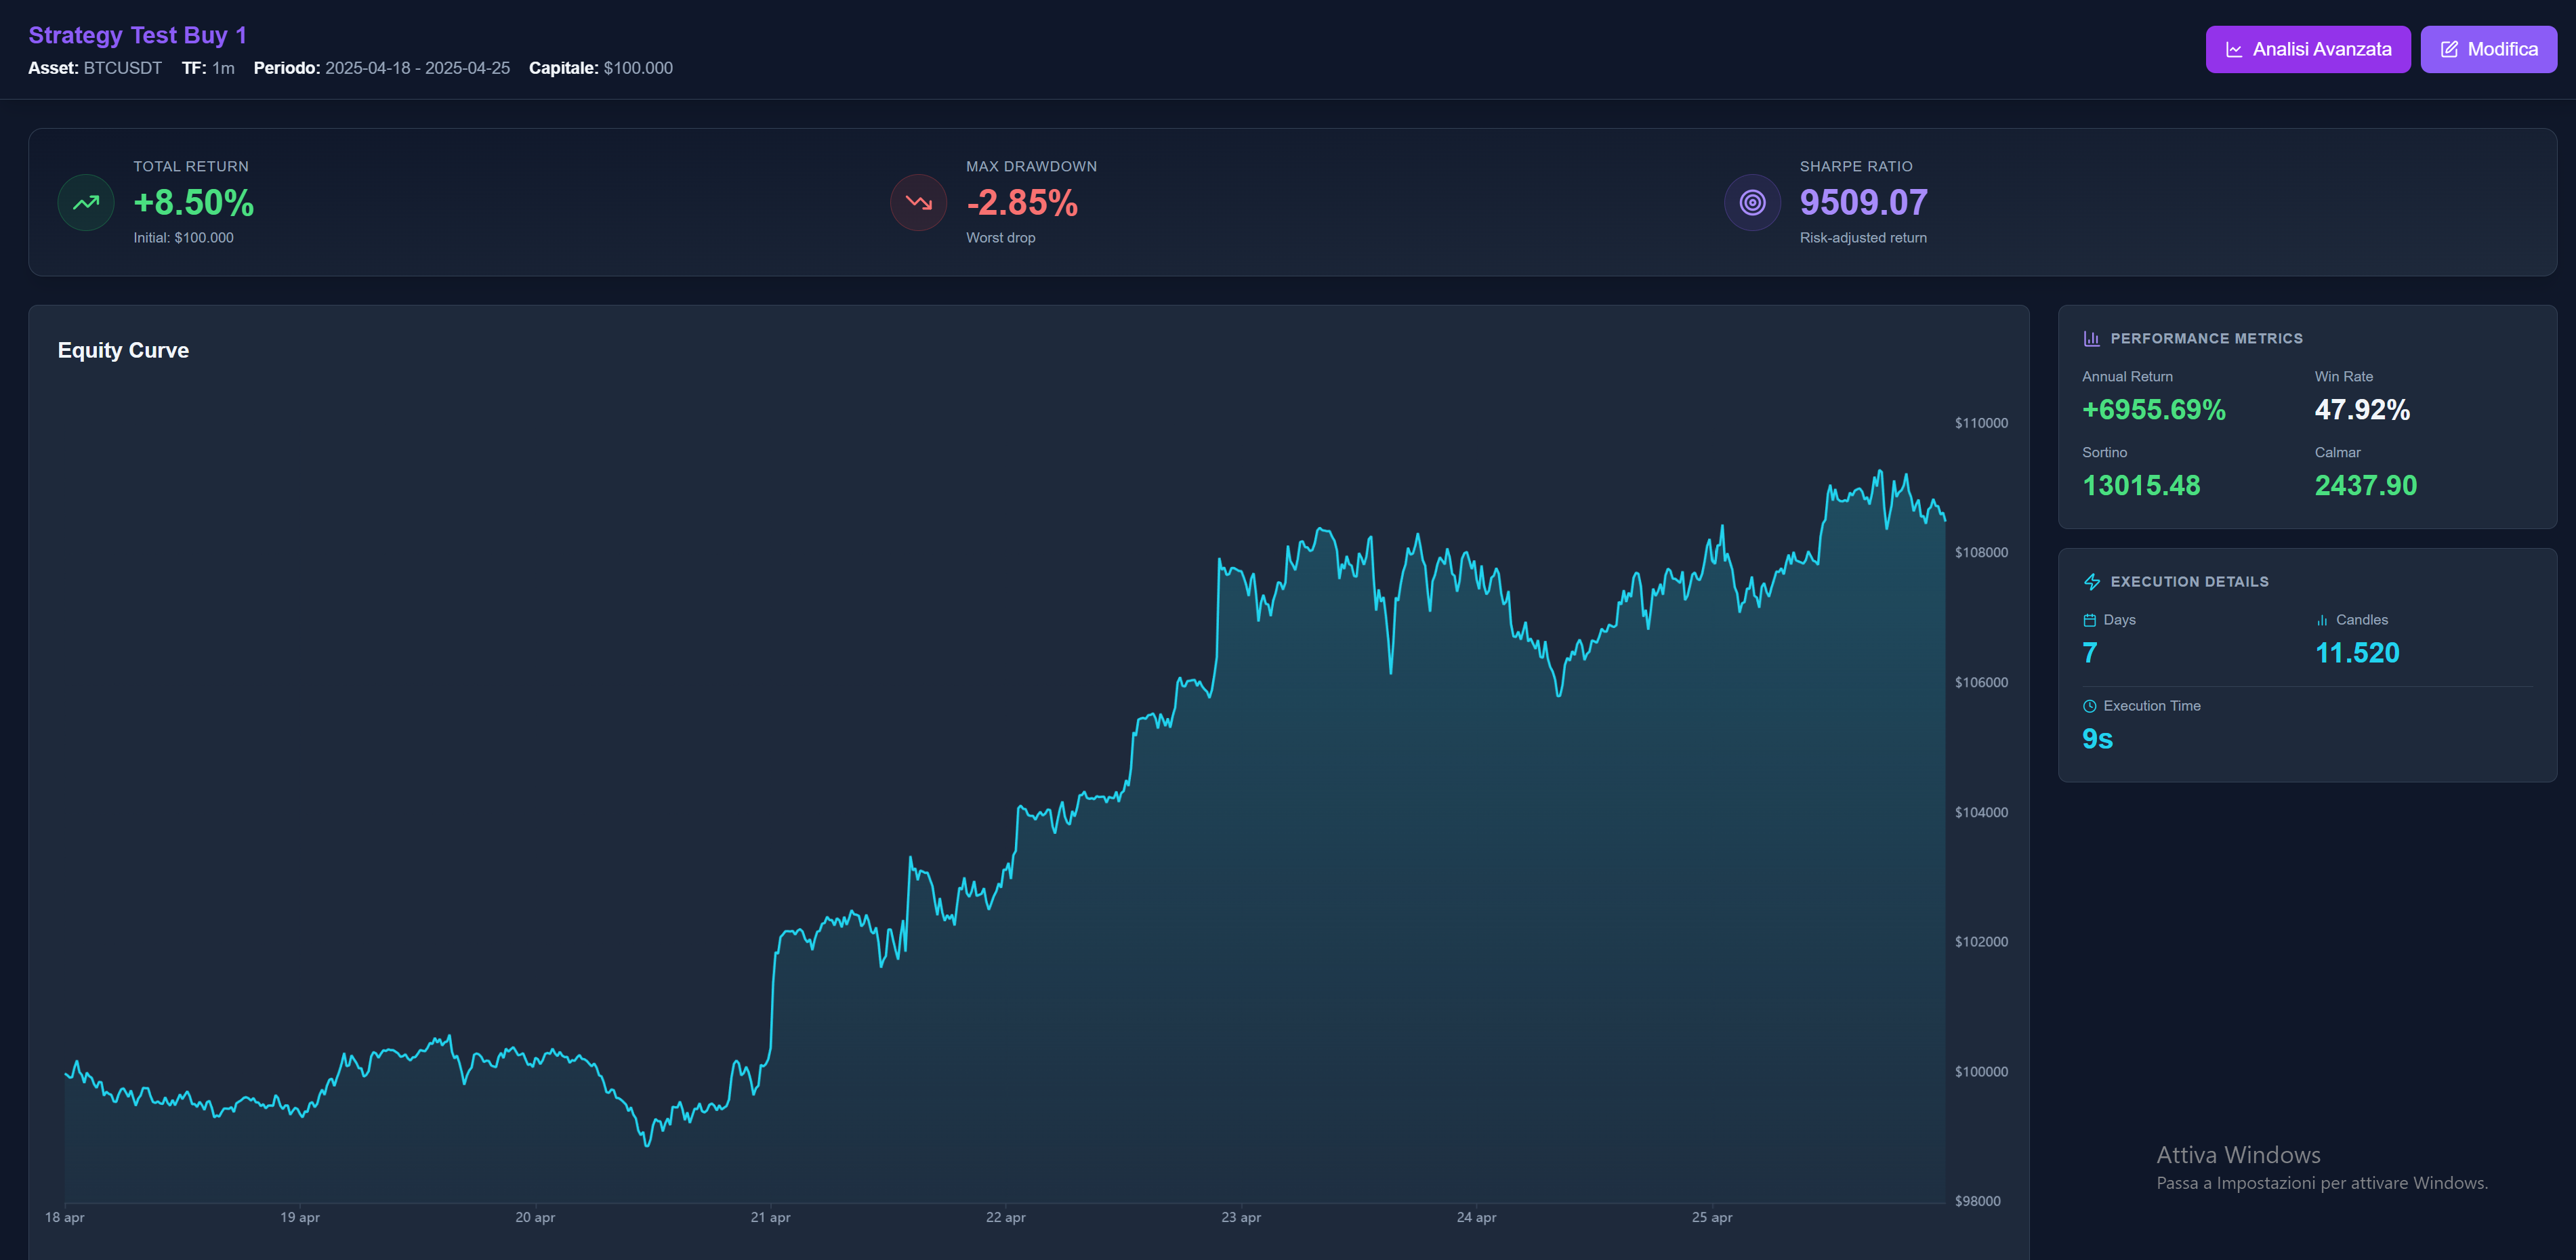
Il Backtesting esegue la strategia su dati storici e calcola metriche di performance per valutare redditività e rischio prima del deployment.
Processo
Il motore esegue la strategia tick-by-tick su dati OHLCV storici, simula l'esecuzione dei trade (ordini e commissioni) e traccia l'evoluzione del portafoglio. Il motore modella le commissioni ma non lo slippage né la latenza in tempo reale. Output: equity curve + metriche di performance + storico completo dei trade.
Metriche Chiave
Sharpe Ratio
Rendimento aggiustato per il rischio. >1.0 buono, >2.0 eccellente
Max Drawdown
Perdita massima dal picco al minimo. Indica il rischio massimo
Win Rate
Percentuale di trade vincenti. >50% più vittorie che perdite
Total Return
Rendimento percentuale totale nel periodo testato
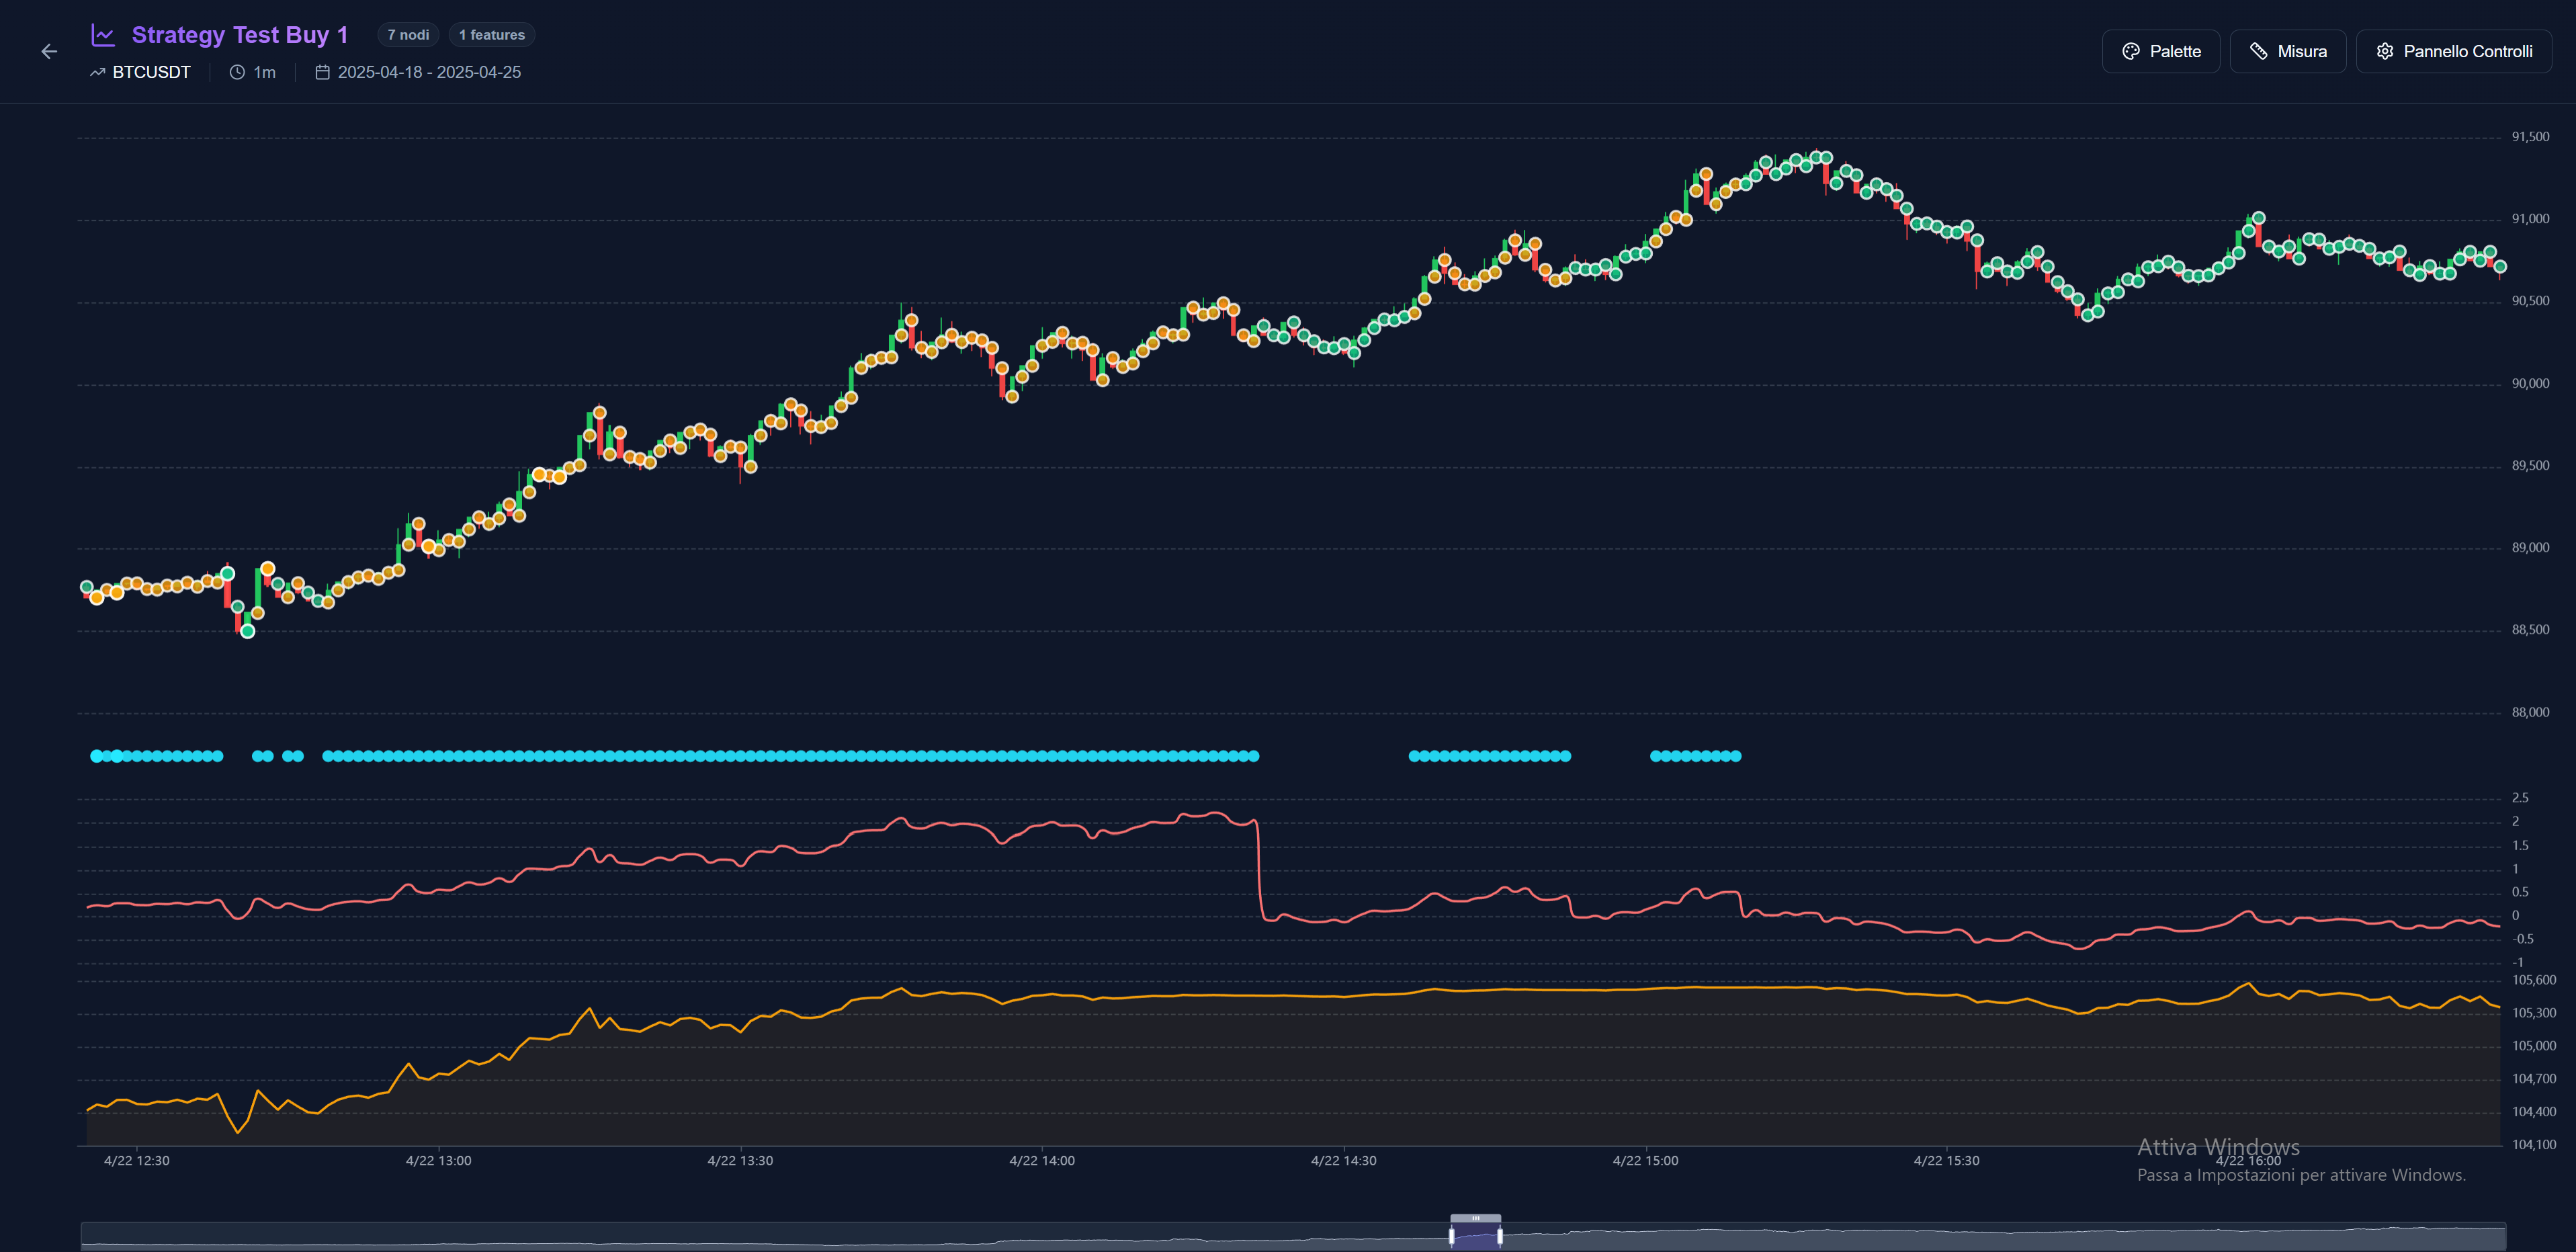
Analisi dei Risultati
Equity Curve: visualizza l'evoluzione del portafoglio, identifica i periodi di drawdown, valuta la regolarità della curva. Storico Trade: analizza la distribuzione P&L, la frequenza dei trade, la durata delle posizioni. Metriche: cerca Sharpe >1.0, Win Rate >50%, Max Drawdown <25%. Non guardare solo il Total Return: strategie con rendimenti alti ma drawdown massicci sono troppo rischiose.
Scopo: Il backtest serve a validare la strategia prima di deployarla in Simulazione. Una strategia che supera il backtest (metriche positive, equity curve stabile) può procedere in Simulazione per test real-time.
Simulazione#
La Simulazione esegue strategie in real-time su dati di mercato live con capitale virtuale. Test finale prima di considerare deployment con denaro reale.
Account Virtuali
Crea account con capitale iniziale configurabile (default $10.000). Ogni account può ospitare più strategie deployate simultaneamente. Allocazione del capitale configurabile per strategia.
Deployment della Strategia
Per deployare una strategia dal Lab alla Simulazione:
- 1.Seleziona una strategia validata tramite backtest
- 2.Scegli l'account di simulazione di destinazione
- 3.La strategia inizia l'esecuzione automatica su dati live
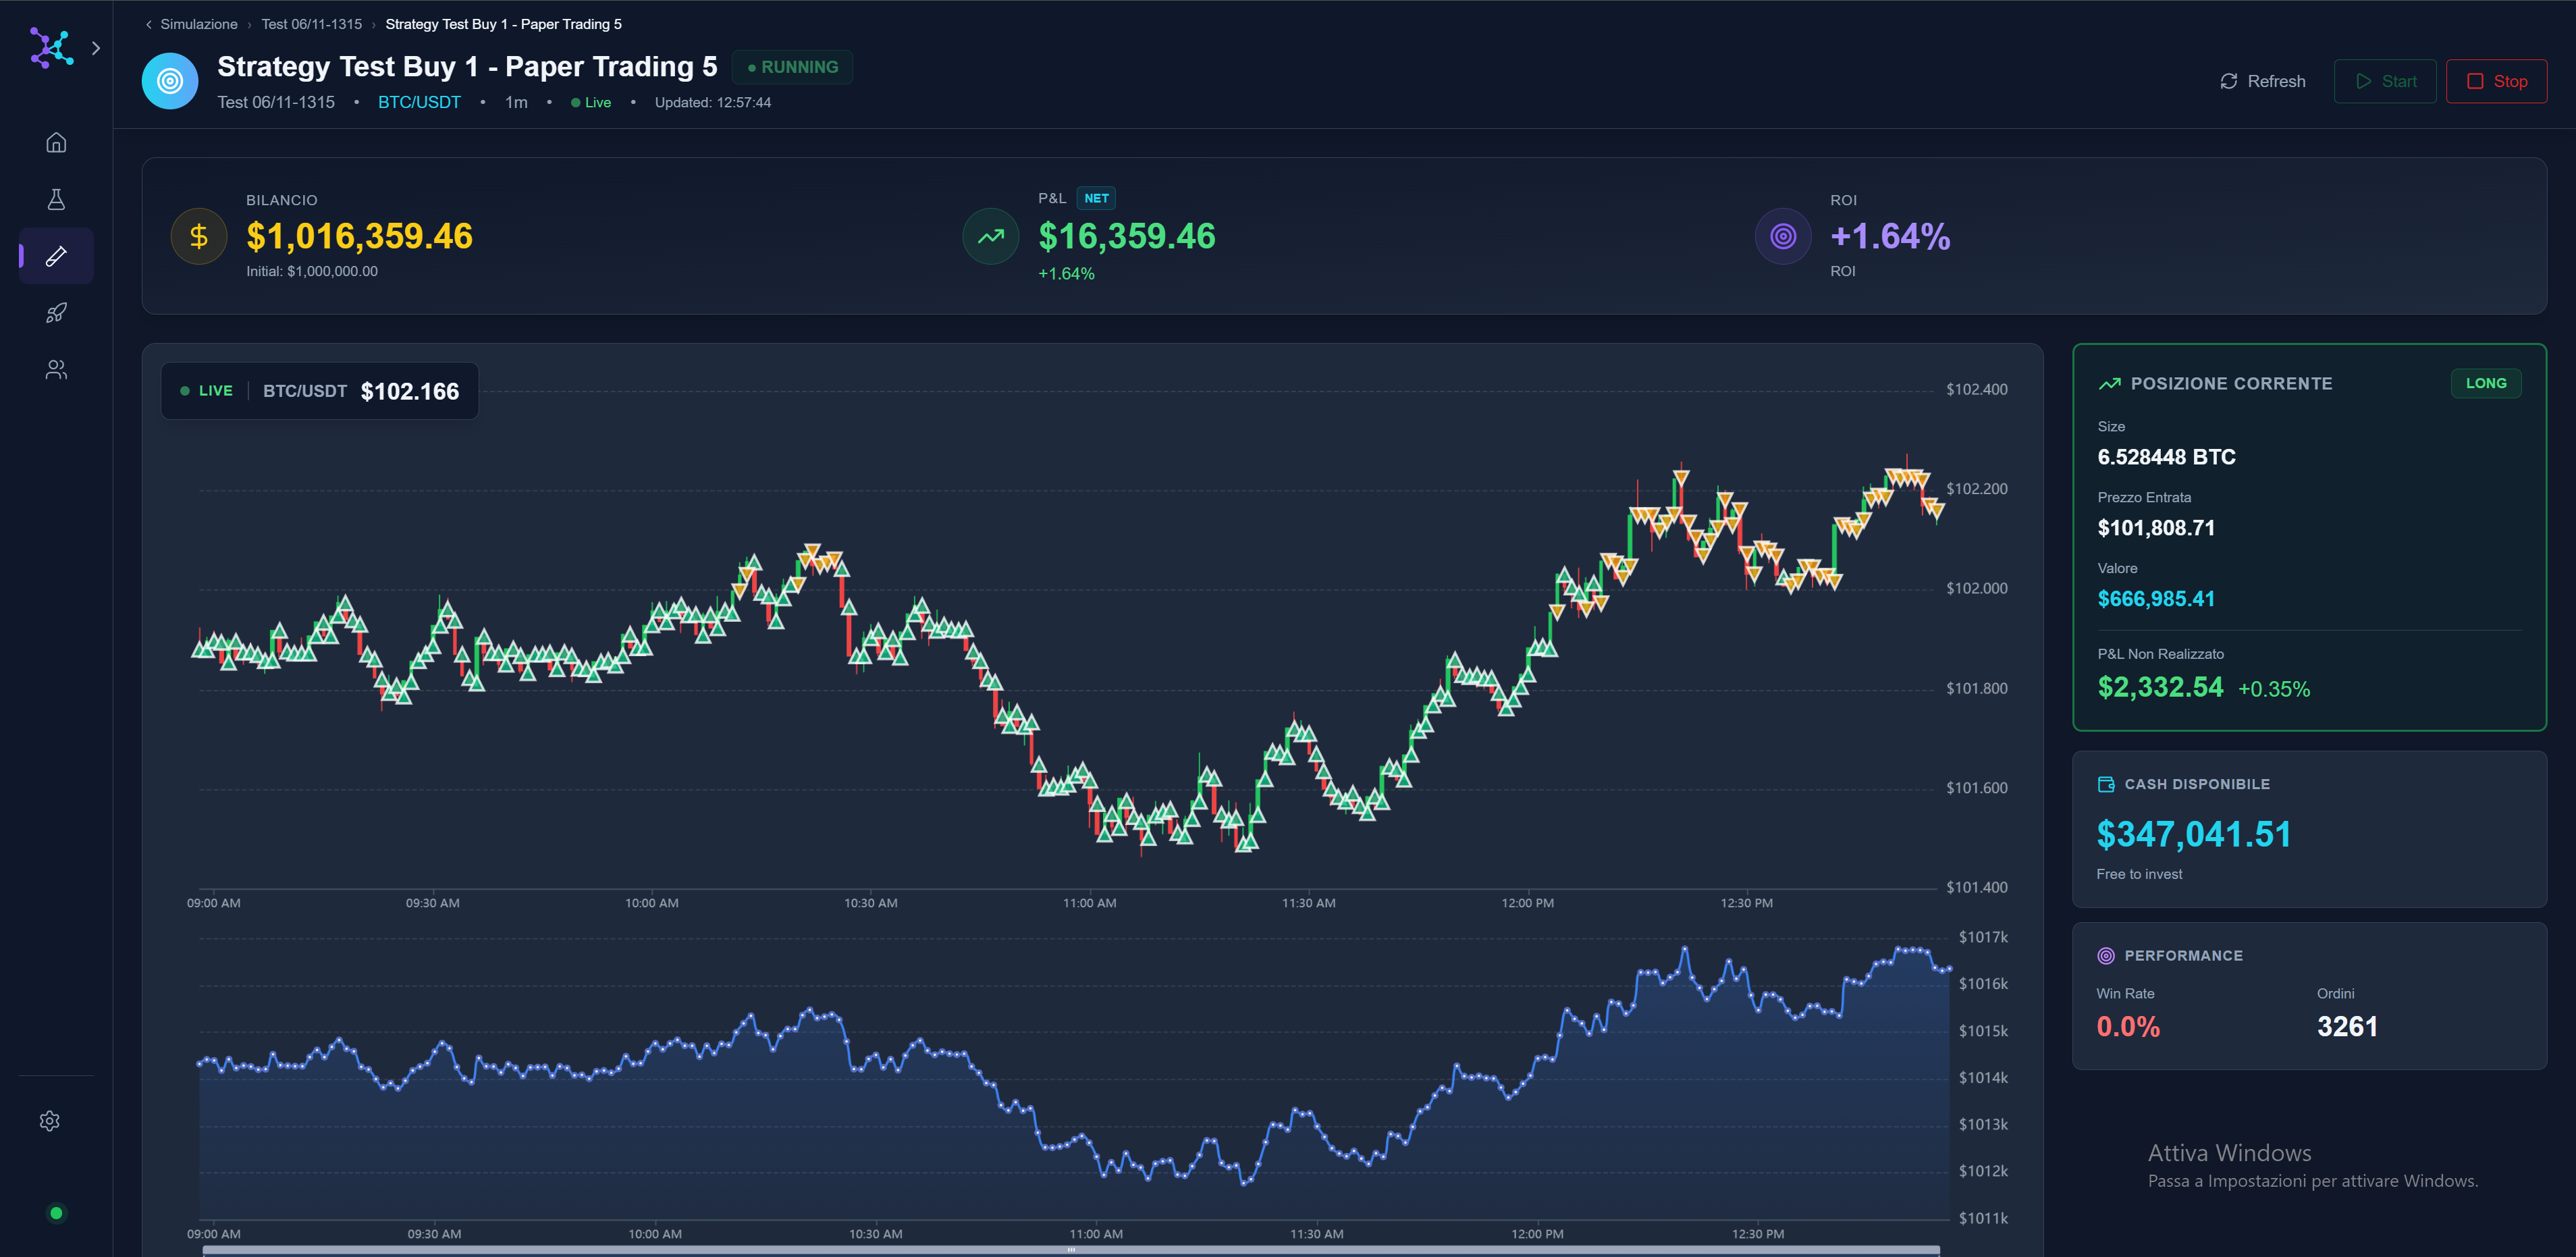
Monitoraggio
La dashboard real-time mostra: posizioni aperte (size, prezzo di entrata, P&L non realizzato), trade eseguiti (entrata/uscita, P&L realizzato), equity curve live, saldo account aggiornato. Ricevi notifiche per eventi importanti (ordini eseguiti, errori).
Dati Real-Time: A differenza del backtest (dati storici), la Simulazione usa dati di mercato live aggiornati ogni minuto. Testa il comportamento della strategia in condizioni reali con latenza e volatilità attuali, senza rischiare capitale reale.
Prossimi Passi
Costruisci la Tua Prima Strategia
Tutorial hands-on per creare una strategia RSI Mean Reversion completa in 10 step
Approfondisci l'Editor Strategie
Scopri tutti i tipi di nodi, le connessioni e le funzionalità avanzate della canvas
Cronologia Revisioni
Ogni salvataggio di una strategia o super-nodo viene registrato automaticamente. Sfoglia la cronologia completa e ripristina qualsiasi versione precedente dalla pagina Cronologia Revisioni.