La Tua Prima Strategia
Impara a costruire una strategia RSI Mean Reversion step by step: dalla configurazione dei nodi all'esecuzione del backtest.
Cosa Imparerai
- ▸Come configurare un nodo Fonte Dati usando la feature RSI già presente
- ▸Come impostare una condizione su una feature
- ▸Come gestire acquisto e vendita
- ▸Come usare un Super-Nodo per gestire la size
- ▸Come avviare il backtest sulla tua strategia
Panoramica#
In questo tutorial costruirai una strategia RSI Mean Reversion partendo da zero. Imparerai a configurare nodi, impostare condizioni e avviare il tuo primo backtest.
Logica della Strategia
La strategia sfrutta il principio del ritorno alla media: quando l'RSI indica condizioni estreme (ipervenduto o ipercomprato), il prezzo tende a correggere verso la media.
- • ACQUISTO: quando RSI < 30 (ipervenduto)
- • VENDITA: quando RSI > 70 (ipercomprato)
- • POSITION SIZE: 1000 dollari statico
Abbiamo scelto questa strategia perché è semplice da costruire e l'RSI è uno degli indicatori più comuni nel trading. È perfetta per imparare i fondamenti della piattaforma senza complessità eccessive.
L'RSI (Relative Strength Index) è un oscillatore di momentum che misura la velocità e l'ampiezza dei movimenti di prezzo su una scala da 0 a 100. Per convenzione, valori sotto 30 indicano condizioni di ipervenduto (possibile rimbalzo), mentre valori sopra 70 indicano ipercomprato (possibile correzione). Il periodo standard è 14 candele.
Nota: L'RSI da solo non garantisce che il prezzo abbia raggiunto un minimo o un massimo effettivo. Tuttavia, rappresenta un ottimo esempio istruttivo per comprendere come costruire strategie basate su indicatori tecnici.
Costruisci la Strategia
Configura Nodo Fonte Dati
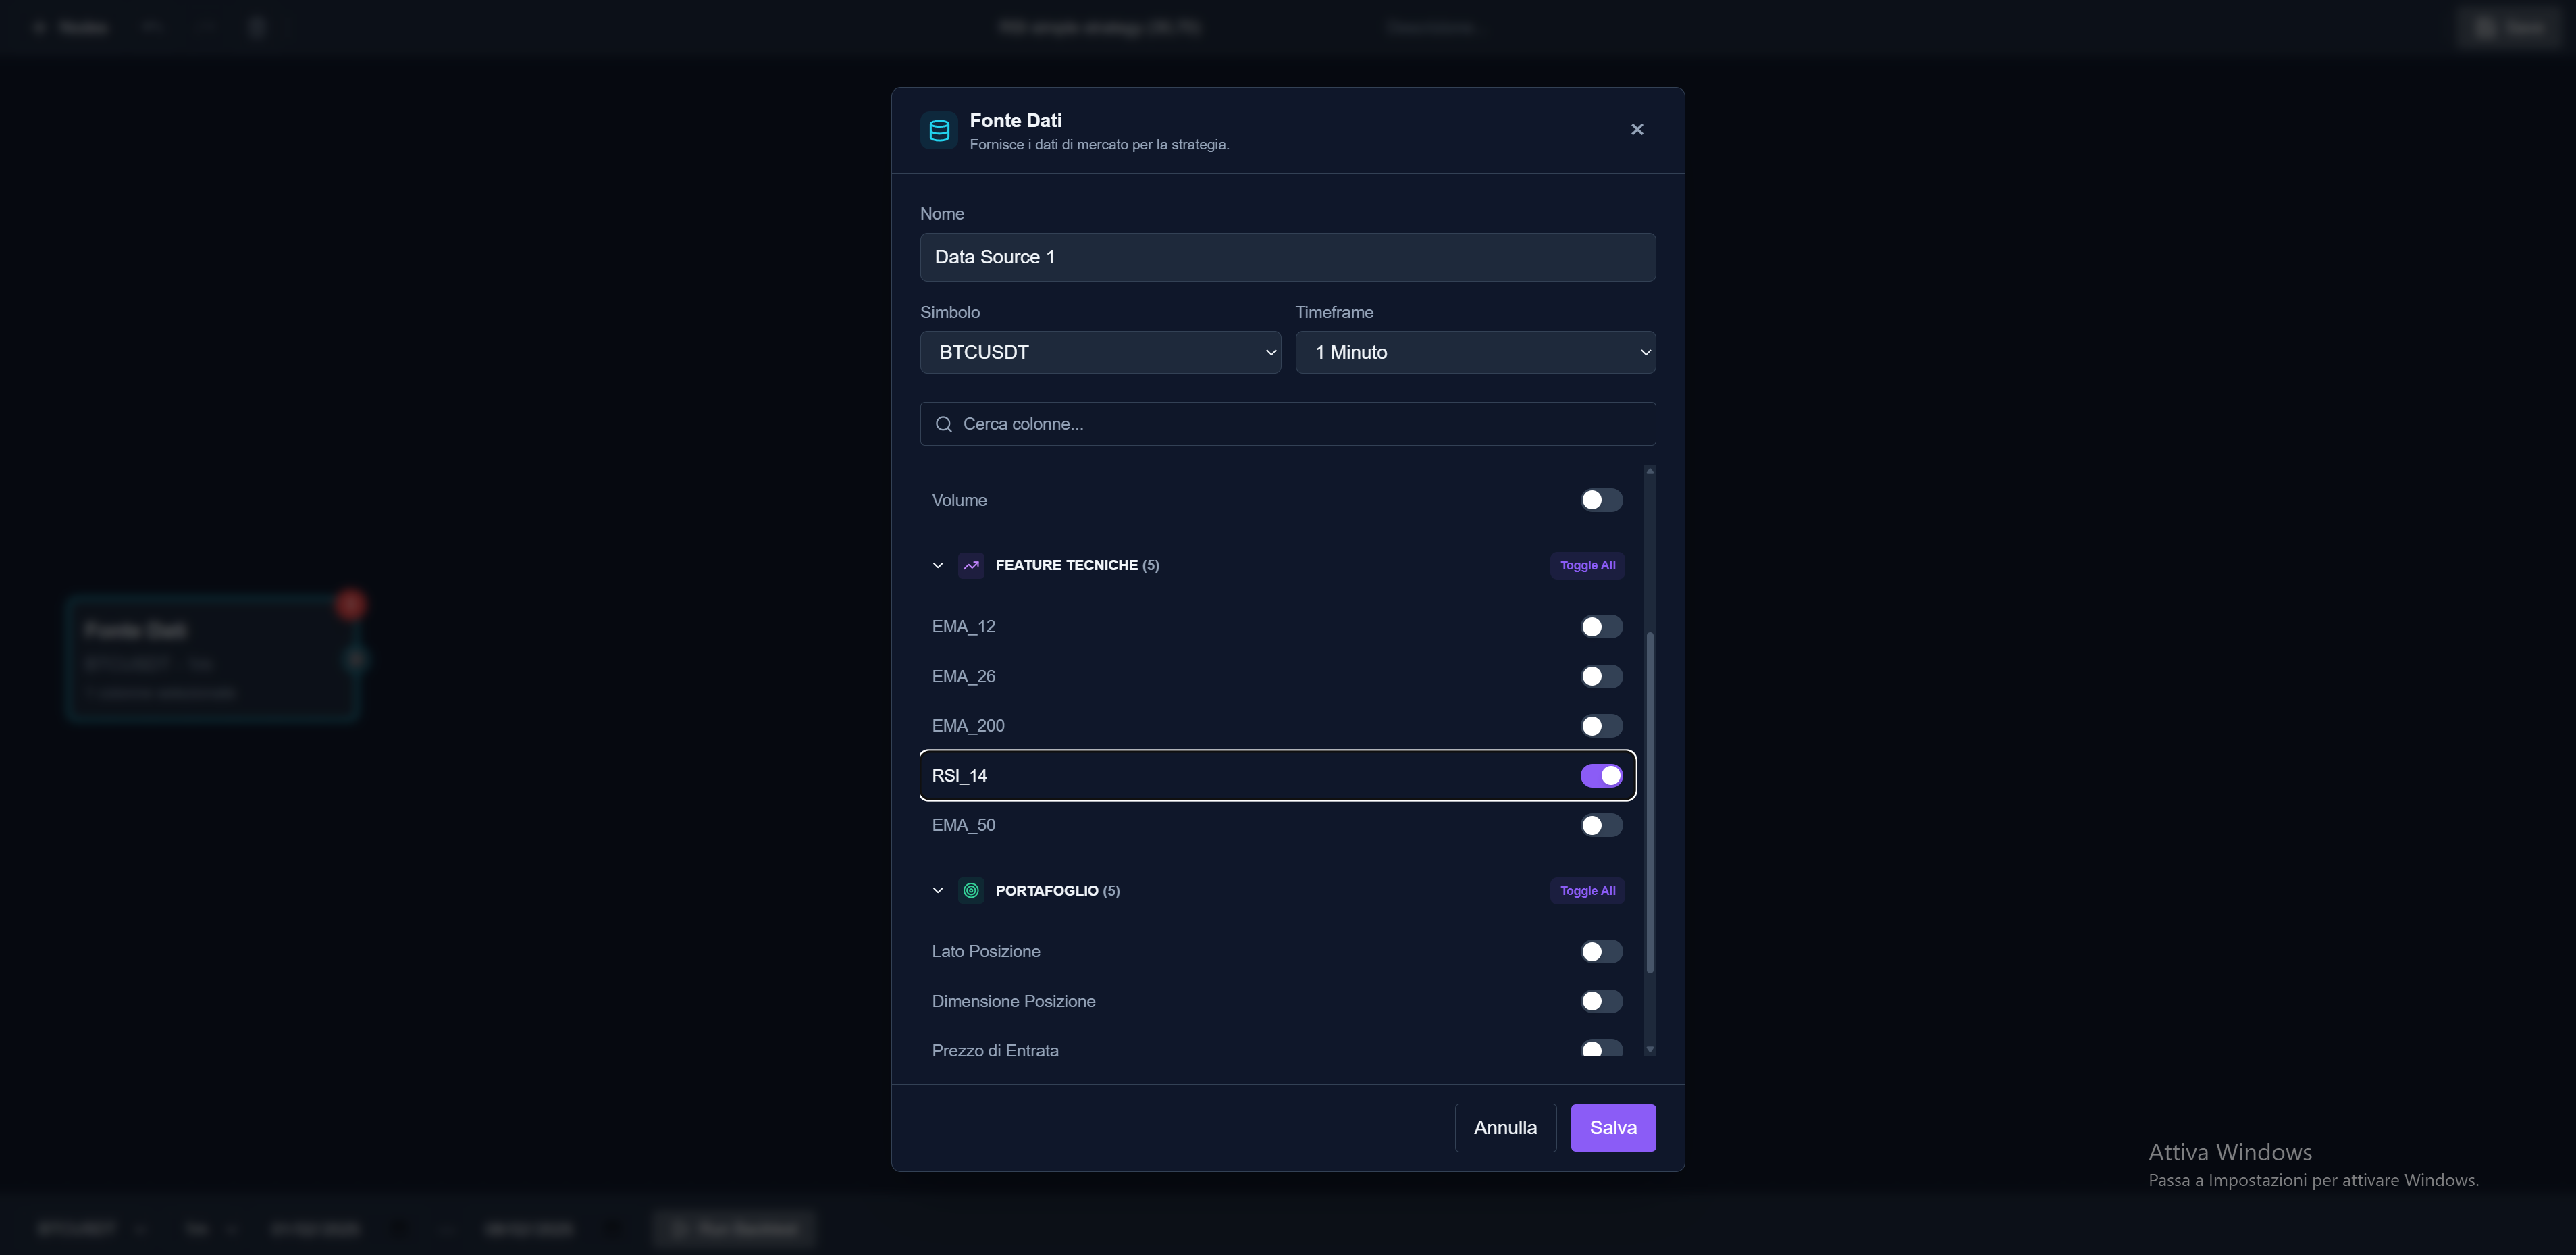
Il nodo Fonte Dati fornisce accesso alle feature calcolate. Configuralo per leggere il valore RSI_14 che useremo per la logica di trading.
- Apri l'editor strategie e trascina un nodo Fonte Dati sulla canvas
- Fai doppio click sul nodo per aprire il pannello di configurazione
- Seleziona la feature RSI_14 dall'elenco delle feature disponibili
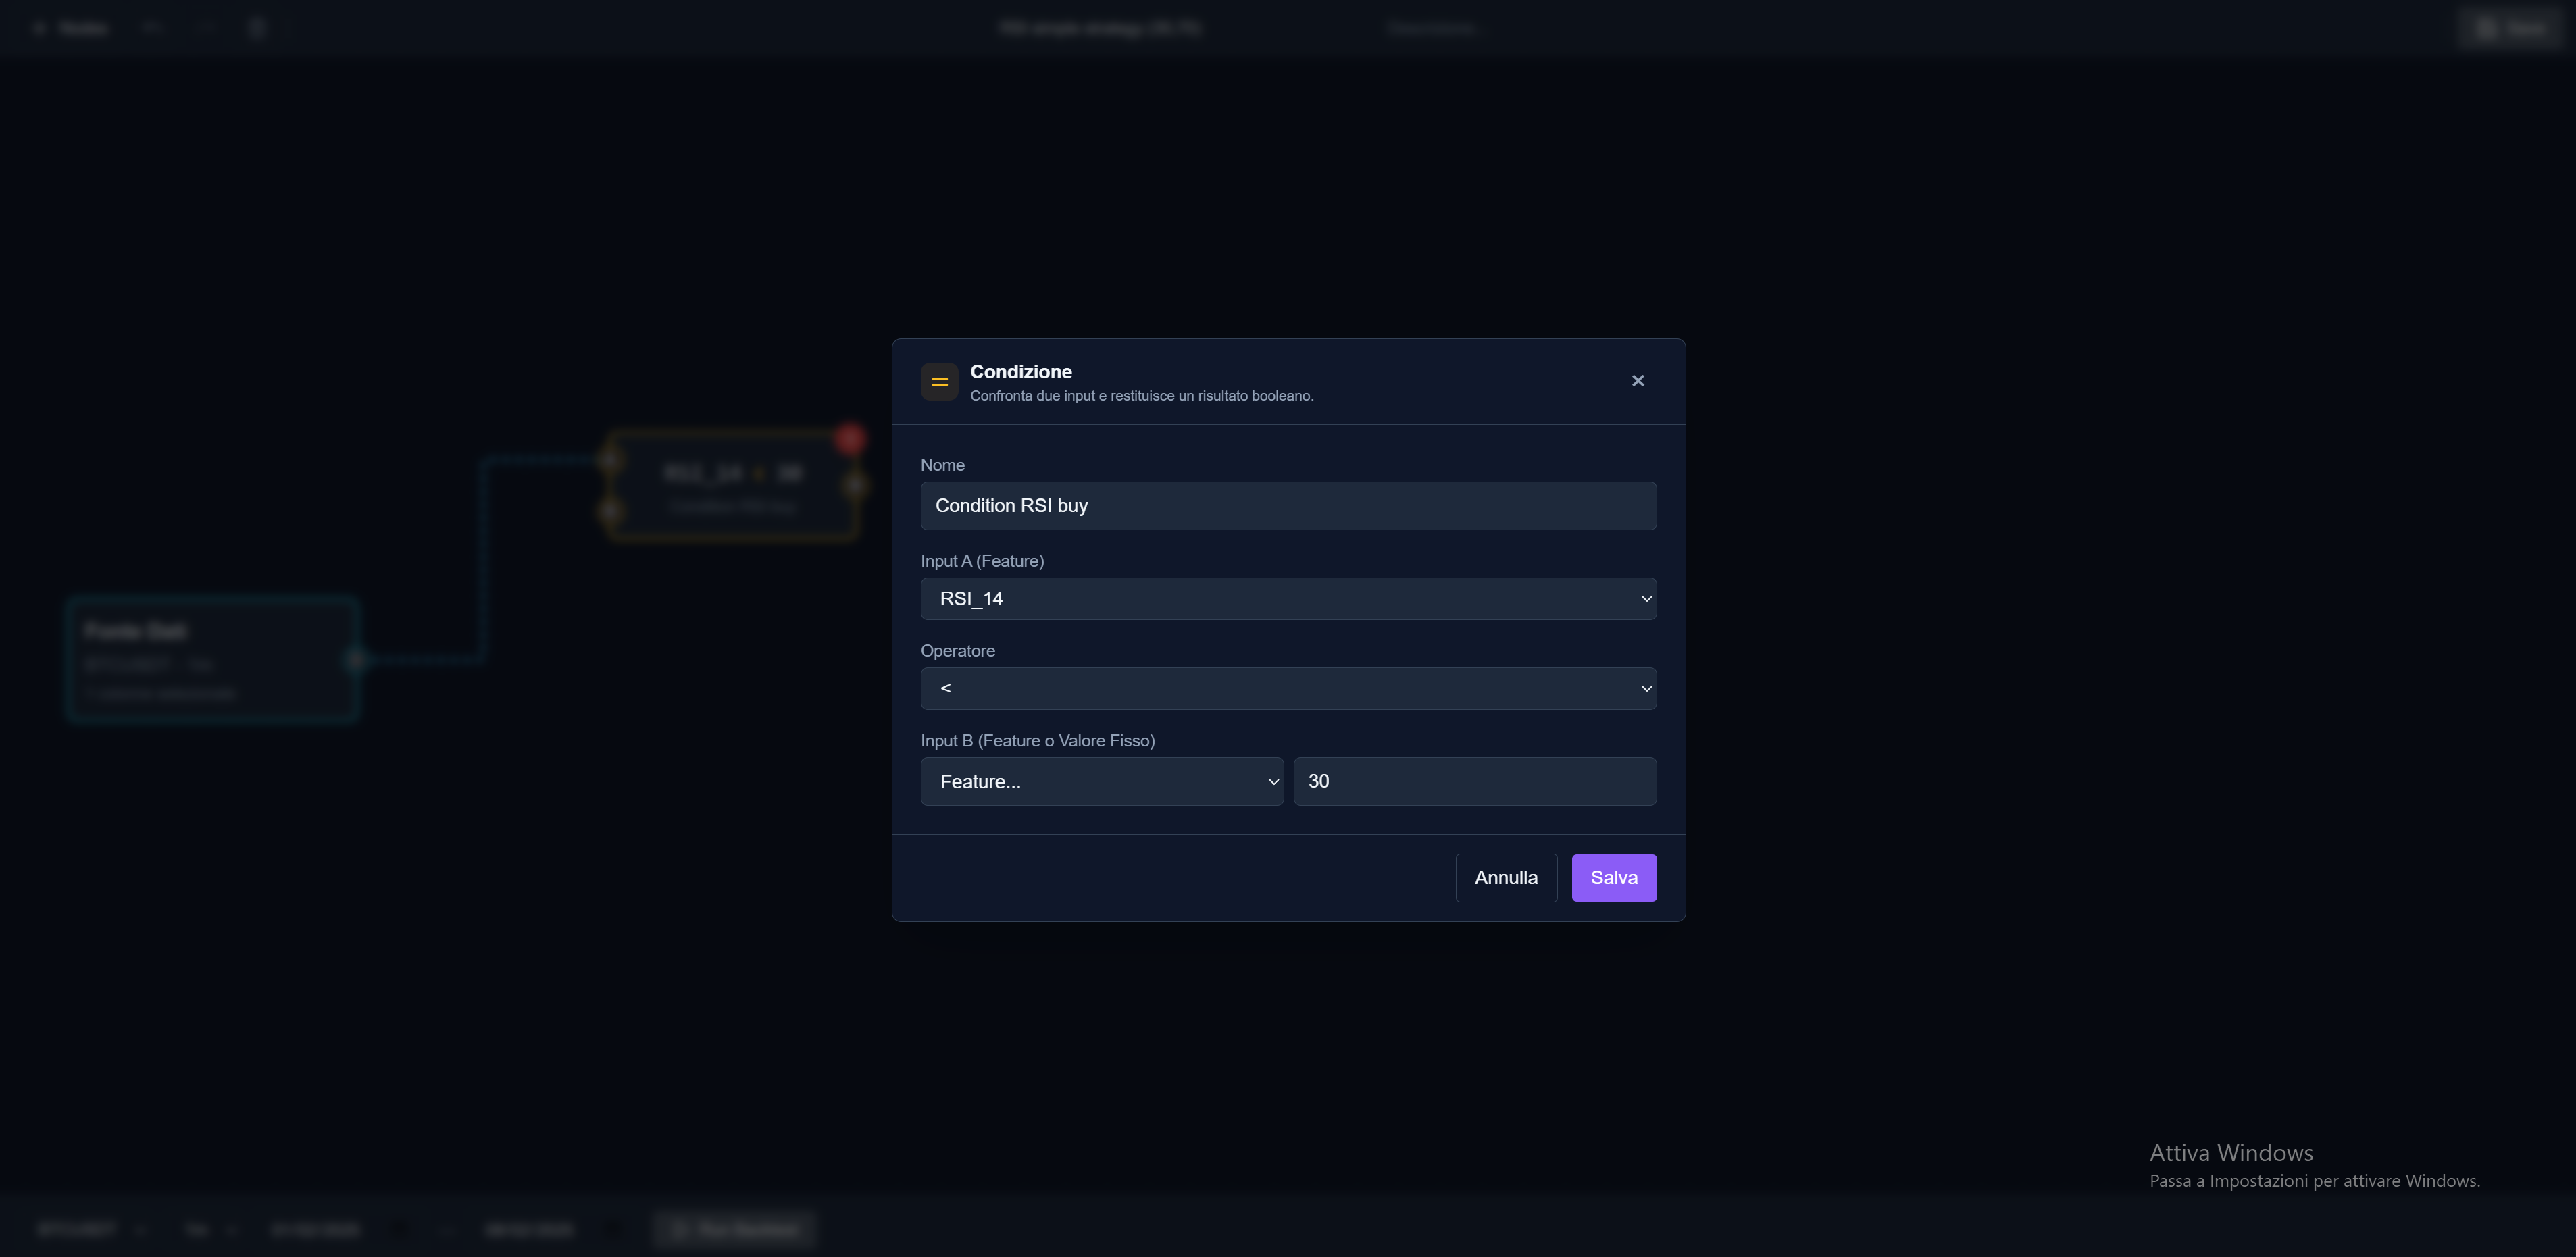
Imposta Condizione Acquisto
Creiamo la logica che genera il segnale di acquisto quando RSI scende sotto la soglia di ipervenduto (30).
- Trascina un nodo Condizione sulla canvas
- Configura l'operatore di confronto: RSI_14 < 30
- Connetti l'output del nodo Fonte Dati all'input del nodo Condizione
- Il nodo restituirà TRUE quando RSI < 30, FALSE altrimenti
Perché 30? Il valore 30 è una soglia standard per identificare condizioni di ipervenduto nell'RSI. Indica che il prezzo potrebbe essere sceso troppo rapidamente e potrebbe rimbalzare.
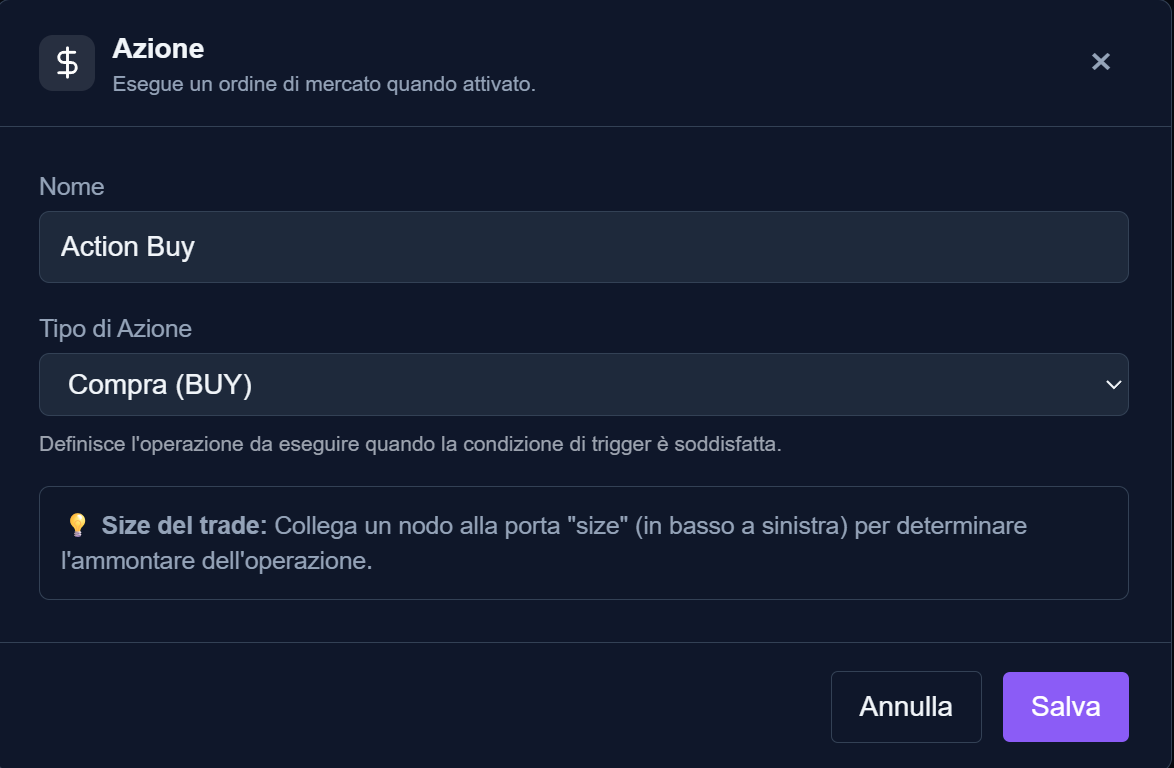
Aggiungi Azione Acquisto
Quando la condizione è vera (RSI < 30), la strategia deve eseguire un ordine di acquisto. Usiamo un nodo Azione configurato per BUY.
- Trascina un nodo Azione sulla canvas
- Configura il tipo di azione su BUY (Acquisto)
- Connetti l'output del nodo Condizione all'input del nodo Azione
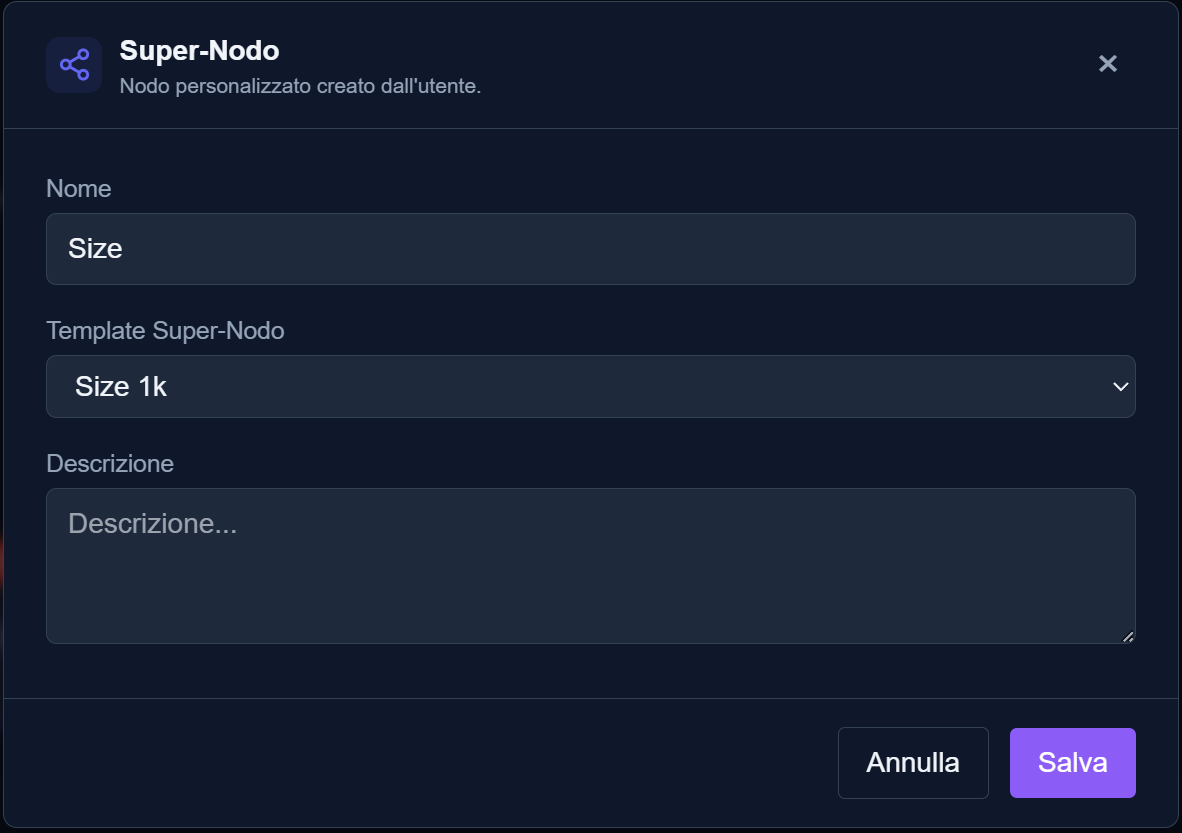
Configura Position Size
Per determinare quanto capitale allocare per ogni trade, usiamo un Super-Nodo che calcola la dimensione della posizione.
- Trascina un Super-Nodo sulla canvas
- Seleziona il template 'Size 1k' dal menu dei Super-Nodi disponibili
- Connetti l'output del Super-Nodo all'input Size del nodo Azione
Super-Nodi I Super-Nodi sono componenti riutilizzabili che incapsulano logiche complesse. 'Size 1k' calcola automaticamente quante unità acquistare con $1000 di capitale.
Esegui Backtest
Ora che la strategia è completa, testiamola su dati storici per validarne il comportamento e analizzare le performance.
- Salva la strategia cliccando il pulsante Salva in alto a destra
- Clicca il pulsante Esegui Backtest
- Configura il periodo di test (es. ultimi 3 mesi) e il capitale iniziale
- Attendi 30-60 secondi per l'esecuzione e visualizza i risultati
Backtest completato! Analizza la curva equity, le metriche di performance e lo storico dei trade per valutare se la strategia è redditizia e robusta.
Complimenti! La tua prima strategia è pronta
Il tutorial base finisce qui. Ora puoi sperimentare con parametri diversi, aggiungere logiche più complesse o esplorare altri tipi di nodi. Le prossime sezioni approfondiscono ogni aspetto - esplora quello che ti interessa di più.
Prossimi Passi
Interpreta i risultati del backtest
Equity curve, Sharpe Ratio, drawdown: scopri come leggere le metriche per ottimizzare la strategia
Scopri tutti i tipi di nodi
Logica OR/AND, operatori matematici, nodi condizionali: costruisci strategie più sofisticate
Crea indicatori personalizzati
Oltre RSI e MACD: impara a creare feature custom e combinarle nelle tue strategie
Testa in simulazione Paper Trading
Valida la strategia in tempo reale senza rischiare capitale, monitorando performance e segnali live
Ottimizza i parametri
Grid search, walk-forward analysis: trova i parametri ottimali per massimizzare le performance
Gestisci il rischio
Position sizing, stop loss, diversificazione: proteggi il capitale con tecniche di risk management